A periodic comparison of key Covid data in Hungary - Err, this does not look good at all!
Immunity by vaccination and infection (cross-immunity) should theoretically prevent this many people from being hospitalised and needing mechanical ventilation. The situation is worse than a year ago also in terms of coronavirus deaths if we compare fatalities to confirmed cases. Overall, we are witnessing a rampant spread of the pandemic – or epidemic, it’s a matter of perspective –; local authorities detect only a fraction of the actual cases, not that they have an inclination to find more (any); the official daily figure should be multiplied by four or five to see a picture similar to the one a year ago. It doesn’t look good, people. It doesn’t look good at all.
Balázs Pártos has put together four charts, using official government data, adding brief explanations to each to describe the current situation in comparison to what Hungary was struggling with a year ago in the coronavirus pandemic.
Number of patients in hospital, days spent in hospital
Charts:
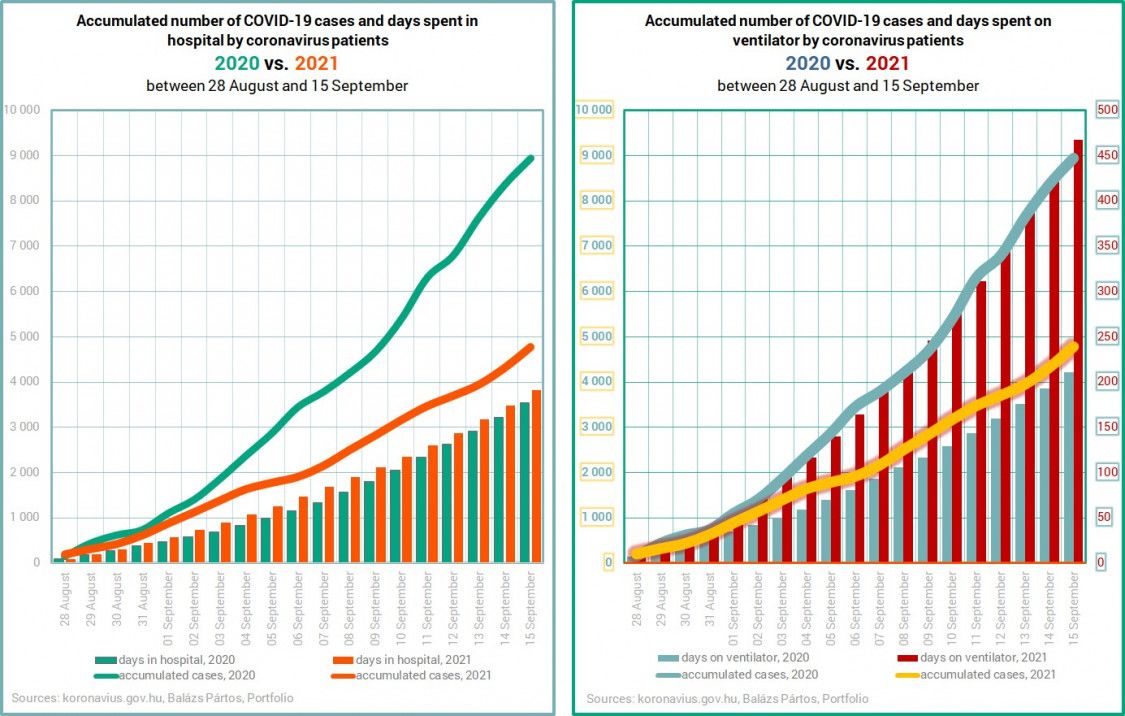
The one on the left depicts the accumulated number of confirmed daily COVID-19 cases and days spent in hospital by coronavirus patients in the period under review in 2020 and 2021.
The right-hand chart shows the accumulated number COVID-19 cases and days spent by hospitalised coronavirus patients on ventilator, also in the period under review in 2020 and 2021.
Analysis:
The left-hand chart depicts the accumulated number of confirmed daily COVID-19 cases and days spent in hospital by coronavirus patients. This was chosen as the first pair of charts, as the message is the starting point of this snapshot / analysis. There accumulated number of new cases in the period under review is about half what we had a year ago, yet those in hospital stay longer.
It is as if only those people were tested that end up in hospital. The orange curve tracks the orange columns pretty well. The same time last year the green curve took off and gained quite a distance from the green columns, i.e. the number of cases rose sharply, but the days spent in hospital did not follow suit, at least not at that rate.
The conclusion is that authorities have practically stopped looking for infected people. Those who are in the statistics are those that sought help because they had severe symptoms.
On the right-hand chart you find that the blue curve correlates most accurately with the accumulated number of COVID-19 patients on ventilator in 2021. Only the latter number is higher this year.
Ratio of COVID-19 patients on ventilator to those in hospital
Charts:
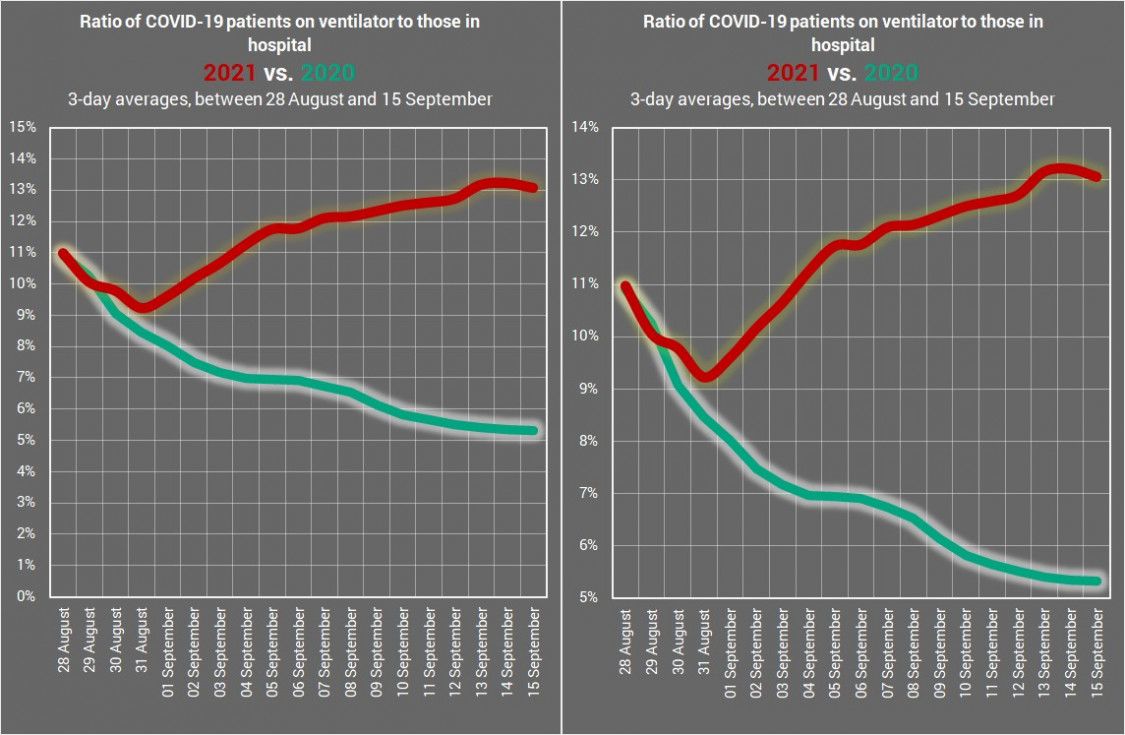
The two charts show the same values, only the one on the right uses a slightly different scale, as it starts at 5% rather than 0%. This is merely to make the changes more apparent, not that the left-hand chart was obscure in this respect.
Analysis:
The percentage of ventilated COVID-19 patients relative to the number of patients hospitalised has been rising in the period under review in 2021, it was dropping in the base period. The gap can only be described as dramatic.
The conclusion is that last year even those with coronavirus infection were admitted that showed moderate symptoms and that is why there were more of them than this year.
If the same admittance approach were used this year, there should be 2.5-3.0 times as many people with COVID-19 in hospital. There are currently 343 people with coronavirus infection in hospital, while in this approach there should be at least 800 to 900 to have the same Ventilated / In hospital ratio as last year.
Patients in hospital, on ventilator, days spent in hospital and on ventilator
Charts:
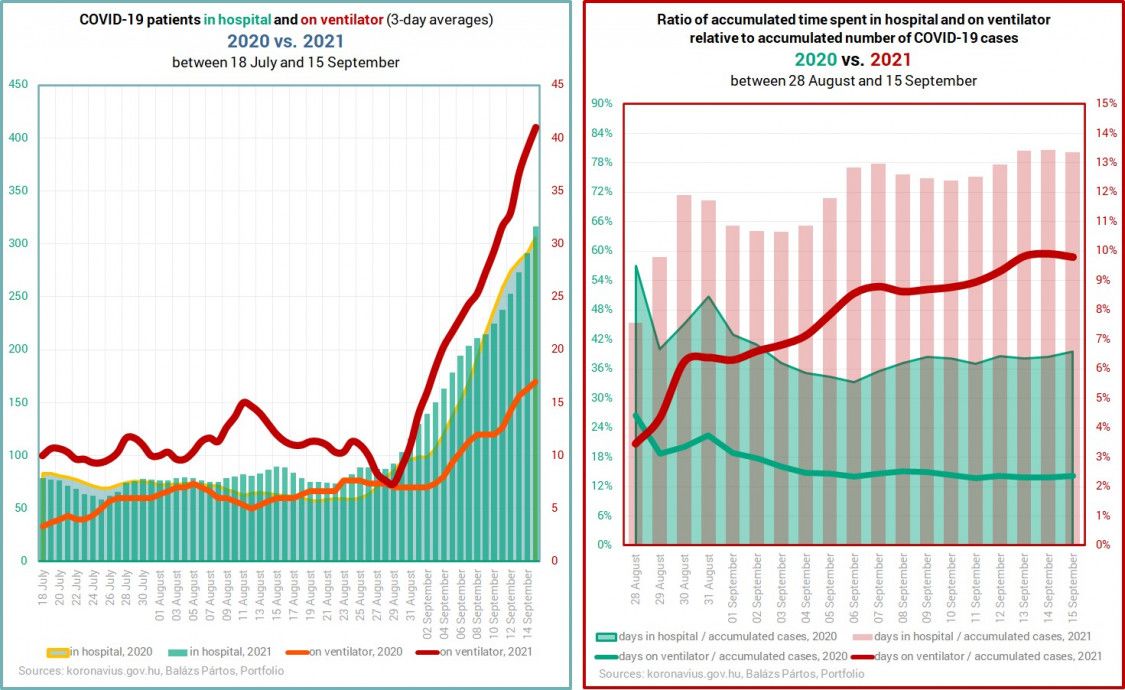
The left-hand chart depicts the number of coronavirus patients in hospital and on ventilator (3-day averages) between 18 July and 15 September, both in 2020 and 2021. The right-hand chart shows the accumulated number of days spent in hospital and on ventilator by COVID-19 patients, also between 18 July and 15 September in 2020 and 2021.
Analysis:
On the left-hand chart we can see that the number of COVID-19 patients in hospital is largely the same both in 2020 and this year, while due to vaccination coverage the number this year should not be even half of what we had last year, especially if cross-immunity gained earlier (in the previous waves or epidemics) work. Yet, the numbers (green columns and green area with yellow curve) basically overlap.
If you look at the curves showing the number of needing artificial ventilation, though… it is obvious what is happening here.
On the right-hand chart, the ratio of days spent in hospital to the accumulated number of COVID-19 cases is close to 80% this year (pinkish columns), while it was not even 40% last year (green area). The conclusion is the same. At least twice as many coronavirus patients should be in hospital to match this ratio, and there are still a lot more than what the number of cases would warrant. If the detection rate of coronavirus infections was low last year, it’s cannot even be registered this year.
The number of days spent on ventilator relative to the accumulated number of new cases was around 2% last year (green curve), while it is around 10% this year (red curve). What’s the deal here?
What we see is the piling up of various factors: (i) underdetection, (ii) fewer people in hospital than there should be, (iii) patients hospitalised in more serious condition. There’s a fivefold difference between 2020 and 2021 in terms of the ratio of COVID-19 patients in ICUs and the number of confirmed cases.
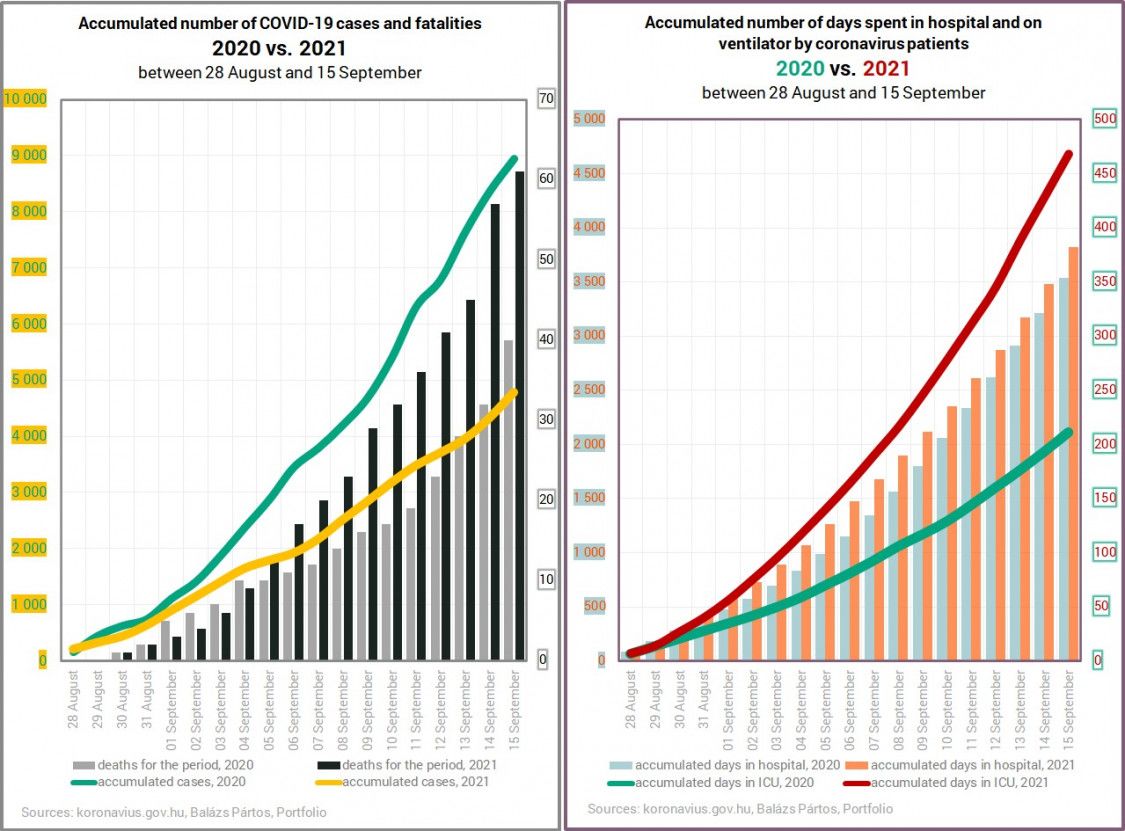
Accumulated number of COVID-19 cases and fatalities, days spent in hospital and on ventilator
Analysis:
On the left-hand chart, the green curve shows the accumulation of new cases in 2020 (in the period under review) which correlates with the black columns, i.e. the accumulated number of COVID-19 deaths in 2021. Why is that? The number of detected cases is half this year than a year ago; see the green and the yellow curves. (Additionally, the test positivity rate is also half, but that’s another story). Meanwhile, a lot more people die of coronavirus-related diseases this year than in 2020 in the period under review (black vs. grey columns).
This wave / epidemic is deadlier than it was in the same period a year ago if we divide the number of COVID-19 deaths with the number of confirmed cases. There’s a five-fold difference! (See above.)
On the right-hand chart you see that the accumulated number coronavirus patients spent in hospital this year is higher than in 2020 in the period under review (orange columns are higher than the light blue columns), while the number of days spent in ICUs is double of the 2020 data. (The number of COVID-19 deaths is also about twice as high; the ratios become the same when the sh…t hits the fan.)
The overall conclusion is that
* we are witnessing a rampant spread of the pandemic – or epidemic, it’s a matter of perspective –;
* local authorities detect only a fraction of the actual cases, not that they are held at gunpoint to find more (or any for that matter);
* the official daily figure should be multiplied by four or five to see a picture similar to the one a year ago.
The real problem is that it’s the middle of September and there are already more than 300 people with COVID-19 in hospital. There should be half as many at most. If we give credit to ‘experts’ approach, there should not be this many people in hospital even at the end of the month.
If this is the ‘wave’ of those that chose not to be vaccinated, it looks like it is going to be a big one, because more than half of the population are inoculated, and more than 70% of the vulnerable age group got their jabs.
So what the hell is this then?
Possible scenarios
There are three possible scenarios, according to Pártos.
1. We are way ahead in relative time, and this is actually a ‘wave’ of unvaccinated people, in which case the numbers will skyrocket shortly. This is the official narrative. Well, not in Hungary, but globally. The Hungarian government believes in Scenario 3. Controversially, this is actually the best-case scenario. If the situation worsens substantially and suddenly, the Delta variant will not last so long. On the other hand, if we are in Scenario 2 (see next) and the situation keeps worsening gradually and for an extended period, then there will be a lot of casualties.
2. This ‘wave’ is affecting everyone, only those that had their shots stand a better chance of avoiding severe symptoms and have a higher chance of surviving an infection. This is practically a new epidemic that we can label as another wave in the pandemic. In that case there will be no sharp rise in the numbers, and the ‘wave’ will have a similar shape as last year only it will go higher. This is the worst-case scenario.
3. Everything will be just fine, because a) we are ahead in relative time, and b) vaccines (all of them, for each age group) and cross-immunity also need to be factored in and matter a lot. In this case, the numbers should start to ebb soon.
At this point and with the available set of data we are likely in some kind of a combination of scenarios 1 and 2. If it is the third scenario then we should see a significant drop in the number of COVID-19 patients in hospital, in ICUs (on ventilator) and in the number of fatalities. If that does not happen by early October, it is definitely not Scenario 3.
Parting words
The situation is much worse than it should be. No matter which of the above scenarios prove correct, this will be a serious ‘wave’ / epidemic, unless it starts to subside markedly within two weeks.
If these trends remain unchanged for another two to three weeks, it’s Scenario 2. If the situation worsens sharply and suddenly, it’s Scenario 1.